GCC Profiling
| Date Published: | |
| Last Modified: |
This article assumes you are using a Debian-based Linux machine (e.g. Ubuntu).
Overview
To use profiling, the program must be compiled and linked with the -qg profiling option:
We will use an called profiling_test.c (full code can be found at https://github.com/gbmhunter/BlogAssets/tree/master/Programming/ProfilingGprof):
| |
We will then compile it with the command:
| |
This creates what is called an instrumented executable. It contains additional code which records the time spent in each function.
If gprof does not appear to produce any output, it may be because of a bug in GCC versions 5 and 6. As a workout, provide the additional flag -no-pie to compilation and linking. Make sure there is only one hyphen at the start of the argument (NOT –no-pie).
When run, the program will produce a file gmon.out in the same directory as it is run. You can pass your program to gprof to display the profiling results:
| |
You can see above that approximately 60% of the time was spent calculating the Fibonacci sequence, while 30% was spent looping 100 million times. If this was a real life scenario, you could now start to optimise your code!
If you find text hard to analyze, see the gprof2dot section below on how to create a visualization of the above results.
The above command will write the profiling results to the terminal. Instead, if you wish to write the results to a file, use the following command:
| |
Clean Exiting
gmon.out is only written to if your C/C++ program exits cleanly, that is, it either calls exit() or returns from main().
Here is the relevant info from the gprof manual:
The profiled program must call
"exit"(2)or return normally for the profiling information to be saved in thegmon.outfile.
Your program doesn’t count as a clean exit if it is running in a Linux terminal and Ctrl-C is pressed! However, there is a way to fix this, by catching the Ctrl-C signal and writing to the file before exiting…
| |
You must compile and link with the -ldl option for dlsym to be found.
gprof2dot
gprof2dot is a tool that can create a visualization of the gprof output. TO install gprof2dot:
| |
To install graphviz (which is needed if you are going to make “dot” graphs like below):
| |
To create a dot graph image:
| |
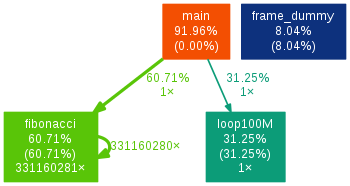
This created the below image for the example code above:
Authors


This work is licensed under a Creative Commons Attribution 4.0 International License .
Related Content
- GCC Compiler Optimisation Levels
- GCC Compiler Errors And How To Fix Them
- pybind11
- GCC Code Coverage
- GCC Bugs